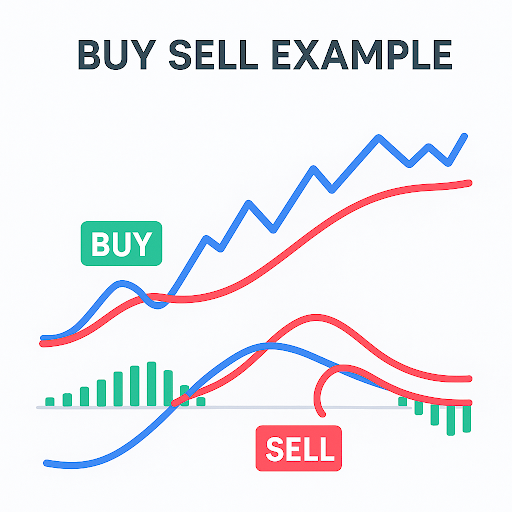
It's quick risky and lucrative to day trade if you know what you're doing. The trading indicator is one of the most important tools in the toolbox of a day trader. With the use of these technical tools you may instantly detect buy/sell chances examine price activity and spot trends.
However, how can one determine which of the hundreds of indicators available are actually useful for day trading?
Let's dissect it and examine the top trading indicators for day trading that can increase your performance and accuracy.
🔹 What Are Trading Indicators?
·
Leading
indicators – Predict future price movements
· Lagging indicators – Confirm trends based on historical data
When it comes to day trading time is crucial. A successful transaction or a lost chance can be determined by the appropriate indicator.
🔸 1. Relative Strength Index (RSI)
Purpose: Measures the speed and change of price movements
Best For: Spotting overbought and oversold conditions
The RSI is a momentum oscillator that ranges from 0 to 100.
·
An RSI above 70 usually indicates that a
stock is overbought
· Below 30 means it's oversold
It's ideal for making fast trades and identifying reversals.
👉 Pro Tip: To eliminate misleading signals combine RSI with a trend indicator such as EMA.
 |
| RSI Example |
🔸 2. Moving Averages (SMA & EMA)
Purpose: Identifies the direction of the trend
Best For: Finding entry and exit points
-
SMA (Simple Moving Average) gives a smooth overview of price trends.
-
EMA (Exponential Moving Average) reacts more quickly to price changes, making it ideal for scalpers and fast trades.
Popular strategies include the EMA crossover (e.g., 9 EMA crossing above the 21 EMA as a buy signal).
 |
| SMA/EMA |
🔸 3. MACD (Moving Average Convergence Divergence)
Purpose: Trend-following momentum indicator
Best For: Catching trend reversals
Day traders like MACD because it is flexible and provides unambiguous buy/sell signals.
Watch for:
-
MACD Line crossing Signal Line → Buy/Sell signal
-
Histogram divergence → Potential reversal
Purpose: Tracks the average price based on volume
Best For: Finding institutional buy/sell zones
A lot of institutional traders use VWAP. It assists you in determining if a stock is trading over or below its fair value during the day.
Many intraday strategies use VWAP as a support/resistance zone.
🔸 5. Bollinger Bands
Purpose: Measures price volatility
Best For: Identifying breakouts and reversals
A main SMA line and two bands plotted above and below make up a Bollinger Band.
·
When price hits the upper band →
Possibly overbought
· When it hits the lower band → Possibly oversold
🔸 6. Stochastic Oscillator
Purpose: Measures momentum and identifies reversals
Best For: Confirming overbought or oversold signals
Similar to RSI, this oscillator operates somewhat differently. In trending markets it's excellent for verifying trade setups.
✅ How to Choose the Best Indicator for You
- Avoid using too many signs as this may lead to misunderstandings.
- Combine a momentum indicator (such as RSI or stochastic) with a trend indicator (such as EMA or MACD).
- Prior to going live, always test your plan on a sample account.
🧠 Final Thoughts
*FAQ's
1 .What is the most accurate indicator for day trading?
✅ RSI
An indicator of momentum that gauges the rate and direction of price changes is the Relative Strength Index (RSI). It helps traders spot overbought and oversold market circumstances and has a range of 0 to 100.
📈 Why RSI is Highly Accurate
·
Quick
Signal Generation: Perfect for fast-moving day trading environments.
·
Clear
Entry/Exit Zones: Over 70 = Overbought (Sell Signal) Below 30 =
Oversold (Buy Signal).
· Versatility: Works across all markets — stocks, forex, crypto, etc.
⚖️ Risk-Reward Ratio with RSI
·
Low
Risk: Enter trades when RSI hits extreme levels, placing stop-loss
just beyond the recent high/low.
·
High
Reward: Catch trend reversals early, increasing profit potential with
minimal drawdown.
· Example: Buy when RSI is near 30 and price starts to reverse with confirmation — ideal 1:2 or 1:3 risk-reward setups.
In order to improve accuracy and eliminate false signals combine RSI with EMA or VWAP.
2 .What are the best signals for day trading?
1. MACD Line and Signal Line Crossovers:
Bullish Crossover (Buy Signal): When the MACD line (faster EMA) crosses above the signal line (slower EMA of the MACD line). This suggests that bullish momentum is building and can be a potential entry point for a long position.
Bearish Crossover (Sell Signal): When the MACD line crosses below the signal line. This indicates that bearish momentum is increasing and can be a potential entry point for a short position or an exit for a long position.
In summary, for day trading with MACD, focus on:
- MACD line/signal line crossovers for entry/exit points.
- Divergences for anticipating reversals.
- Histogram for early momentum shifts.
- Optimized settings for your chosen timeframe and asset.
- Confirmation from other indicators and price action.
- Always prioritize risk management.


Comments
Post a Comment
ThankYou!